Interactive Pie Chart
What causes of oil spills are there and which happen most often?
Hover your mouse over any slice on the Cause by Incident pie chart below! A box appears to explain what oil spill cause that slice represents, how many incidents there were(out of 4,640), and the percentage of that cause from the total.
Interesting Statistics About Oil Spills
How dangerous are oil spills?
When thinking about the consequences of oil spills, questions of safety come to mind. Are workers hurt? Is the environment hurt? Or surely the build-up of pressure within the pipes is what causes all these incidents? The table answers these questions by showing how often this occurred in about 4,640 incidents since 2010.

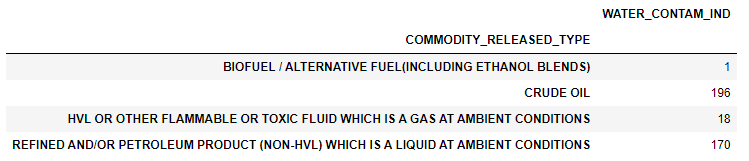
Water Contamination
When looking at the table above, the percentage of times an incident led to water contamination is the most significant-looking statistic. After reading about the Michigan oil spill on the Home Tab and seeing that in 8.3% of incidents water is contaminated, the question follows: what is the water usually contaminated with? The table shows what types of oils were involved and in how many incidents from January 2010 until November 2021.
Cause Boxplot
What is a boxplot?
A boxplot is used to depict the range of a dataset and some statistical qualities about it. You will find things like the mean, median, quartile ranges, and minimum and maximum displayed in a boxplot. Within the boxes, you will see a orange line at the center which shows the median of the data. The small green triangles represent the mean. The box displays the interquartile range, and the attached whiskers on top and bottom of the box show the minimum and maximums of the data (excluding outliers). Please note: Outliers were removed for cleaner data and better visuals.
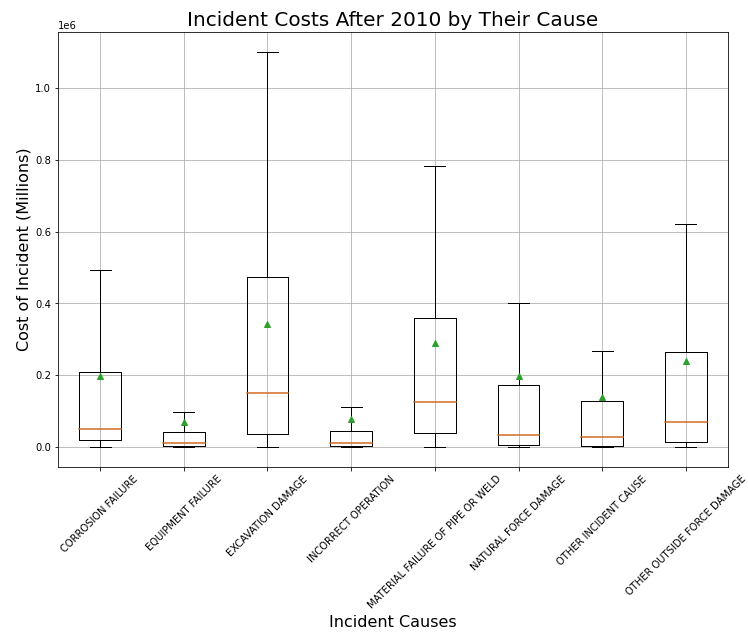
Cause Boxplot
For the plot below, we are looking at the cost of incidents. The data is split into 8 categories so that we can visually compare between the cost of events with different causes. At first glance, it is evident that oil spills caused by excavation damage have the highest maximum. However, the true maximum of the entire dataset is an outlier in the 'Material Failure of Pipe or Weld' category that cost $840,526,118.
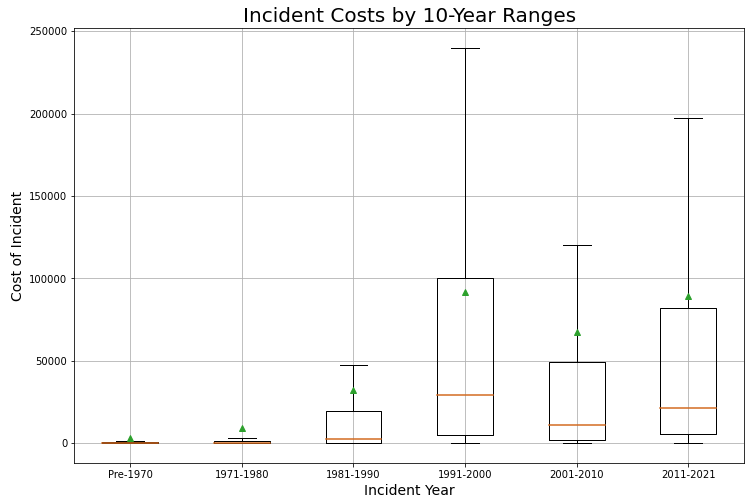
Year Boxplot
This plot, like the Cause Boxplot, shows cost of oil spill incidents. The data here is split into ranges of 10-year periods. It is worth mentioning that the wild outlier we talked about before which cost $840,526,118 would have fallen into the 2001-2010 category as it occurred on 07/25/2010. Please note: Cost is not adjusted for inflation.