Unsupervised Machine Learning Model Summary
In order to find commonalities amongst oil spills, we performed an unsupervised machine learning model to create clusters. We then compared each cluster to gain insights into similarities between oil spills from January 2010 to November 2021. We included the main cause of each spill, whether the pressure exceeded maximum operating pressure (MOP), and the age of the facility at the time of the spill in our model. What we found is that there isn’t a unique combination of these three factors that contribute to oil spills. The chart below shows the nine clusters, hovering your mouse over the data points shows which class each is in. The nine clusters consist of eight clusters for each cause where the pressure did not exceed MOP, regardless of age, and one for when the pressure exceeded MOP, regardless of cause or age.
Model Development
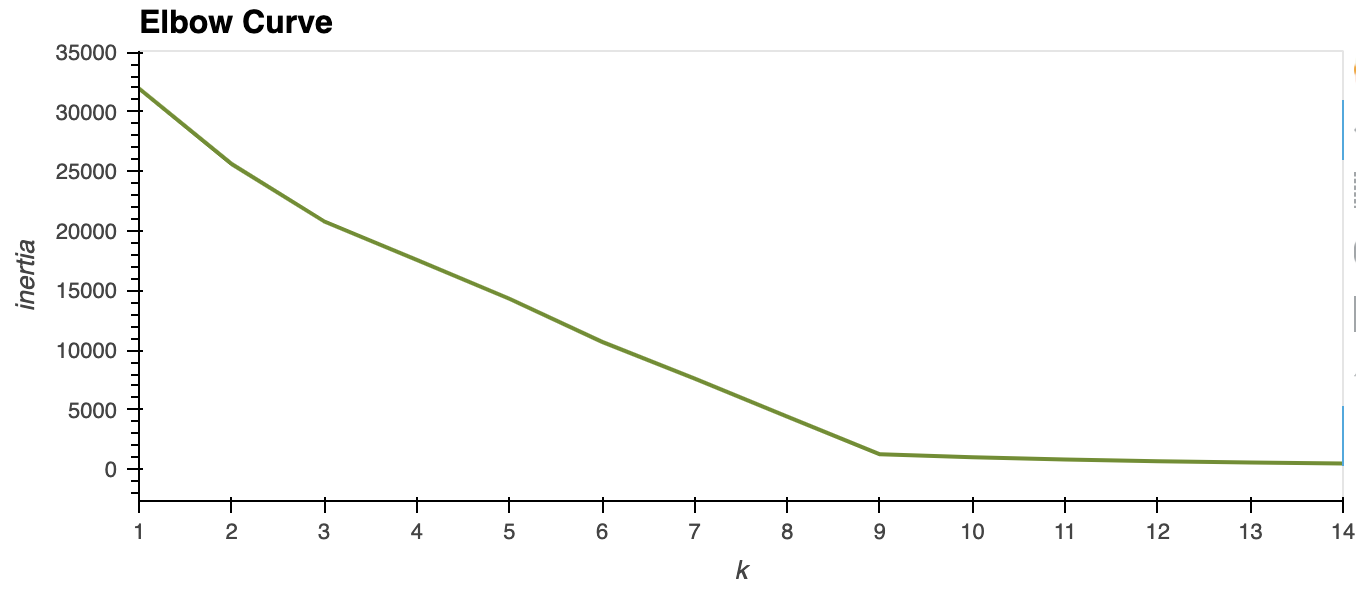
After cleaning and scaling the data, the first step in developing this model was to determine the appropriate number of principal components to use. This was done by increasing the number of components until the explained variance ratio of the components added up to 95%, which resulted in 8 principal components. This means that 95% of the variance in the model can be explained by having 8 components. Next, we created an elbow curve using Kmeans to determine the ideal number of clusters. According to the elbow curve, as seen below, our model required 9 clusters. Lastly, we fit and ran the model using 9 clusters, the results of which are described in the next section.
Cluster Details
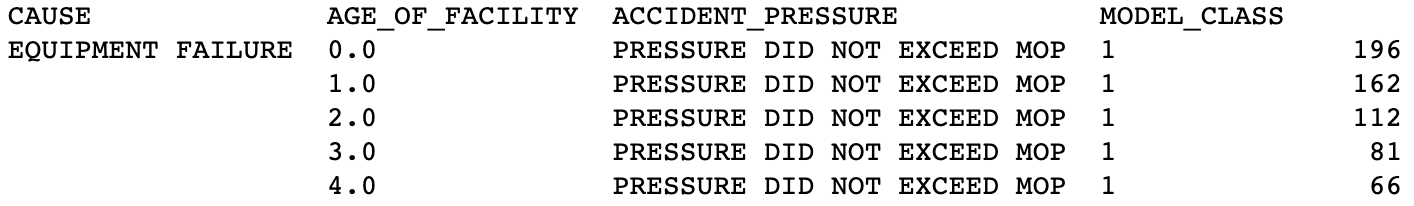
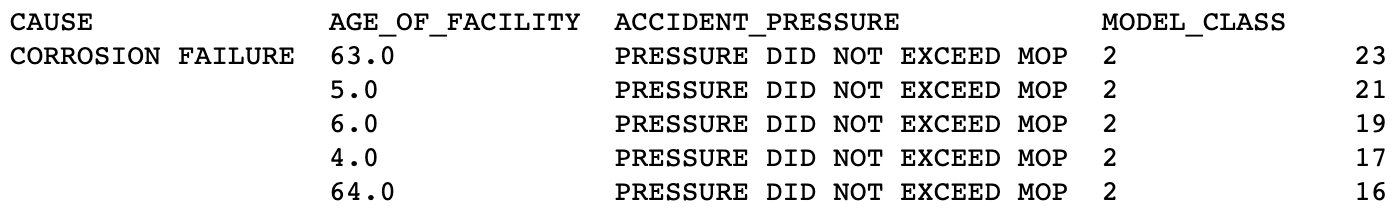
The cluster with the most data points was class 1, and it consists of the equipment failure cause. Similarly, the class 2 cluster consists of the corrosion failure cause. The pictures below show the breakdown of the three elements in classes 1 and 2. While the age of the facility did not have an impact on the clusters themselves, we do see that there is a trend in the age range within each cause. For example, corrosion takes time, so the ages of facilities experiencing corrosion failure are going to be older. The spills that happen due to equipment failure more closely match the overall age breakdown of all the spills in the dataset. Another interesting thing to note is that the general age of the spills in this data set are quite low. This can likely be attributed to improved record keeping in recent years resulting in more accurate recorded installation dates.
Class 1 Breakdown
Class 2 Breakdown
Summary
While the unsupervised machine learning model did not provide the exact results we were hoping for, it did help us to gain additional insights into the pipeline incident data. The most likely cause of a pipeline incident is equipment failure by far (almost double the next cause), and likely within the first 2 years of operation. The second most likely cause of a pipeline incident is due to corrosion and the third is due to incorrect operation. The pie chart on the incident stats tab shows the total count for each incident cause. For pipeline operators, this information could help determine where to allocate resources and monitoring in order to avoid pipeline incidents.