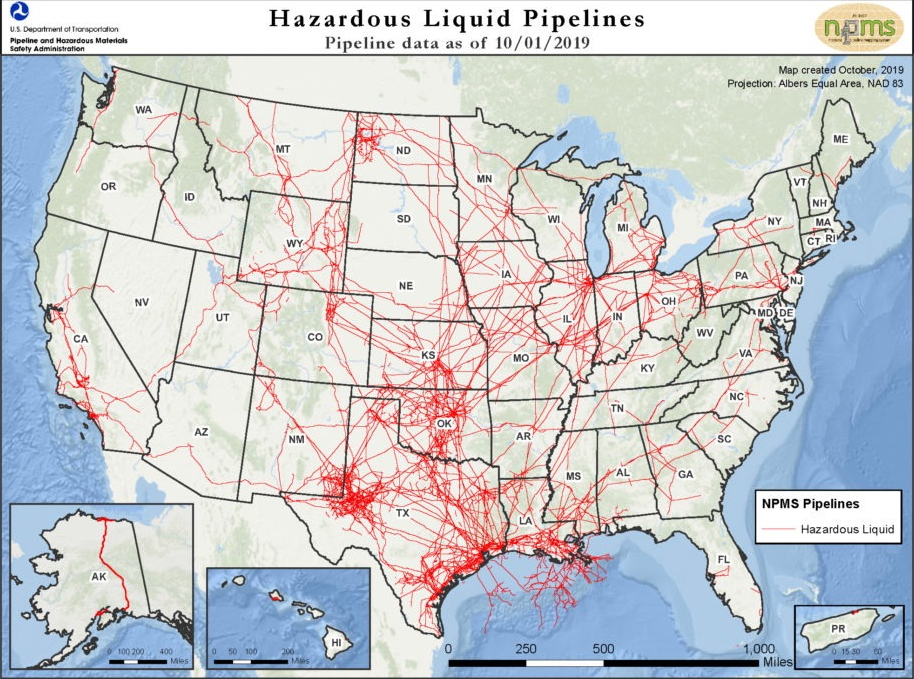
US Pipeline Incidents
Pipeline and Hazardous Materials Safety Administration (PHMSA),
the federal agency that supervises the nation's pipeline system, estimates
there are approximately 2.6 million miles of pipeline in the US. Of these
millions, there are just under 219,000 miles of pipeline carrying oil, refined products, and natural
gas or liquid petroleum. These connect producing areas like drilling sites to refineries and chemical plants, and delivering the final product
to consumers and businesses. The first map to the right shows this expansive US pipeline network running
through Alaska, tapping Oahu, Hawaii, spanning coast to coast, and reaching the Gulf. PHSMSA cites that
over one million hazardous materials are shipped by land, sea, and air every day.
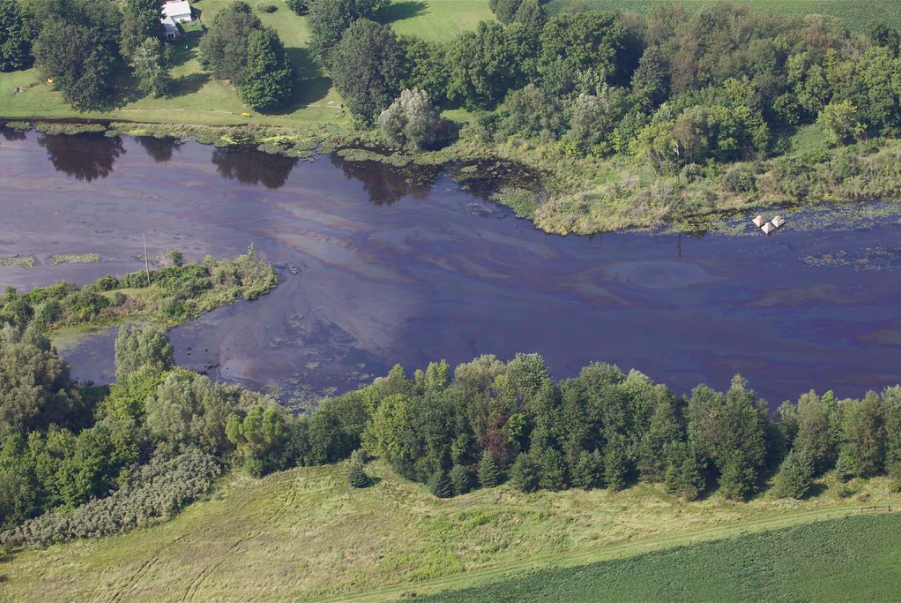 An arial view of the Kalamazoo River July 28, 2010
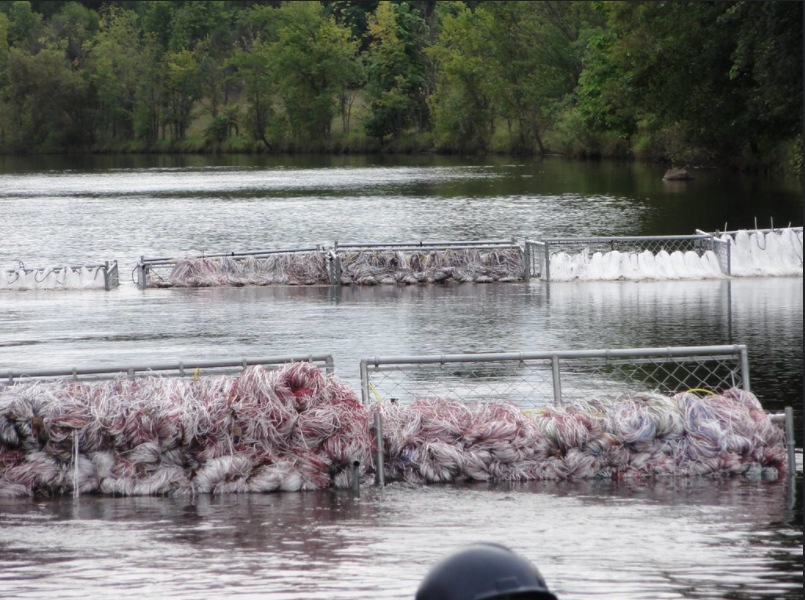 Gabion Baskets Aug.27, 2010
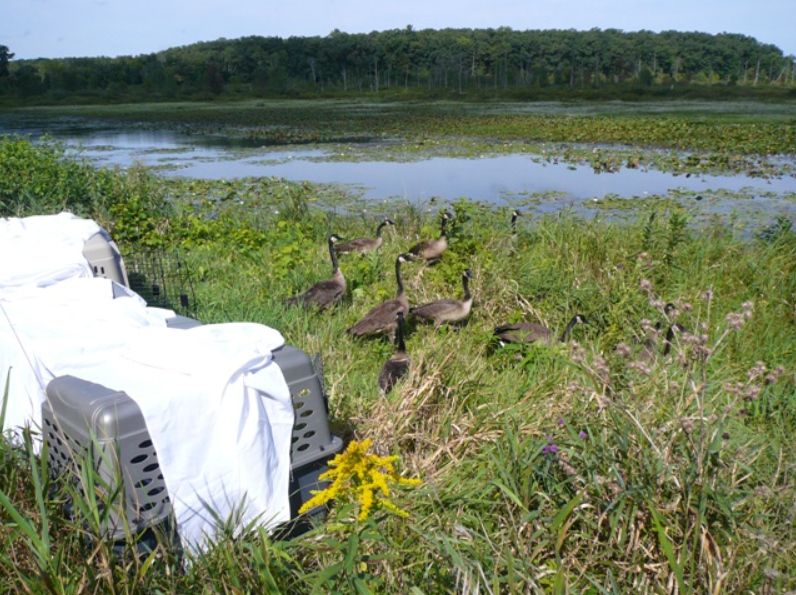 Ducks being released back into the river Aug. 17, 2010
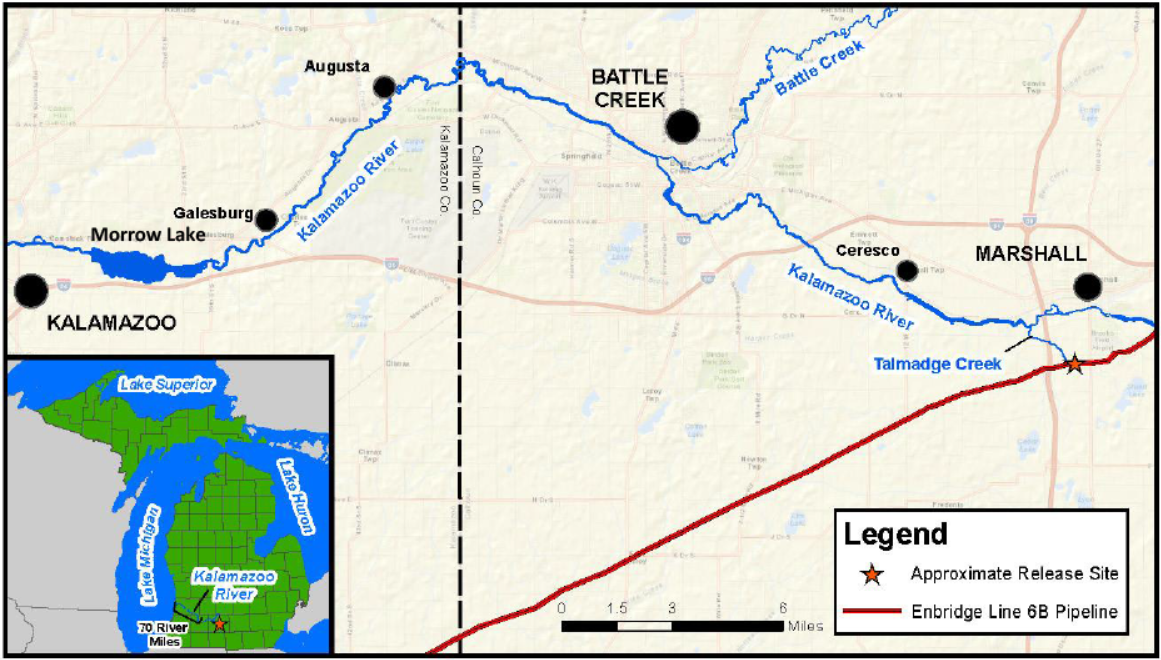 A map of the river and towns affected